Data handling
Posted on November 21, 2014 | By Peter Brookes | 1 response

Data Handling in Stroxworthy Class

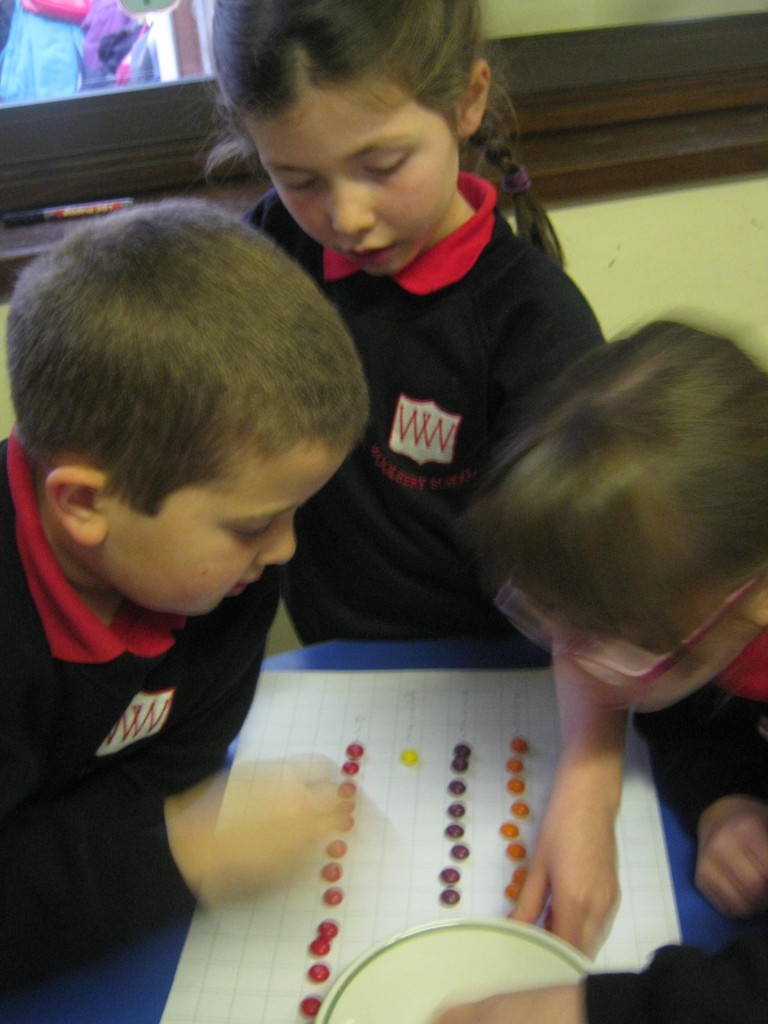


On Friday Stroxworthy Class investigated the different coloured sweets in a packet of Skittles.
First they sorted the sweets into colours and then recorded the data as a tally chart.
As you can see from our pictures, they then sorted the sweets to make pictograms and bar charts.


Wondered why Charlie wanted to buy some Skittles the other day… did all the data recording in his tummy!