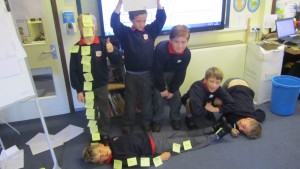
Human bar graphs
Posted on October 3, 2016 | By cdavieswoolsery
Today in Maths, we were learning about how to display data (information). We looked at the population of the world and then created a human bar graph to show how many people lived in each continent. 


